Weather forecast on the app home page
On the home page of the fruitweb app you will find the current data from your weather station and a weather forecast for the next 7 days. We get the forecast from the Swiss provider Meteoblue. It is updated twice a day (10 a.m. and 10 p.m.) and is displayed for the location selected in the „Station“ field.
Explanation of the various display parameters
The relevant period for displaying the values always covers the range from midnight to midnight.
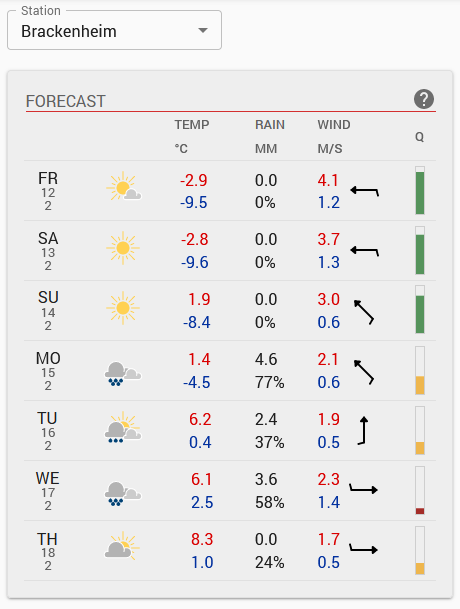
TEMP ° C: In addition to the date and the weather icon, the forecast air temperature at a height of 2 m is displayed in °C. The maximum value is shown in red (above) and the minimum value in blue (below).
RAIN mm: The rain is displayed in two values. The upper value indicates the forecast amount of precipitation in mm. The lower value is the probability of rain in percent. The lower the value, the lower the probability that it will actually rain.
WIND m/s: This column shows the expected wind speed in meter per second on the one hand and the main wind direction on the other. The wind speed is shown as a maximum value (red) and a minimum value (blue). The main wind direction is shown in the form of an arrow.
Q: Generally speaking, the further a weather forecast lies in the future, the less precise it becomes. However, this only applies to a limited extent for the 7-day period we considered. During this period, the prevailing weather situation plays an important role in assessing the quality of the weather forecast. Meteoblue therefore provides a value that shows how reliable the forecast is. This is shown by us in a colored bar with five levels.
Dark red: very imprecise prognosis
Orange: inaccurate forecast
Yellow: average accuracy of the forecast
Light green: high accuracy of the forecast
Dark green: very high accuracy of the forecast
More detailed information on the forecast can be found in the weather data graphic. There you can see the development of the various parameters in detail.