Forecast model Apple Scab Secondary Infections
The Mills curve
In 1944, Mills described the relationship between temperature and leaf wetness with regard to apple scab infections. McHardy and Gadoury 1989 and Stensvand 1997 adapted Mills‘ results and differentiated with regard to ascospores and conidia. Schwabe also made the observation in 1984 that the sensitivity of fruits to apple scab infestation decreases as they develop.
Infection curves
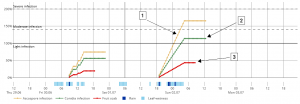
The infection rate is slightly higher with ascospores (primary infections) than with conidia (secondary infections). This is reflected in the infection curves with varyingly steep increases.
1. Yellow: Infection by ascospores on the leaves
2. Green: Infection through conidia on the leaves
3. Red: Infection caused by conidia on the fruit
Intensity of infection
The intensity of the infection is shown in the graphic as a percentage. The three lines mark the following intensity levels:
100%: light infection
140%: moderate infection
200%: severe infection
Literature
1. Mills, W. D.: E#cient use of sulfur dusts and sprays during rain to control apple scab. In: Cornell Extension Bulletin 630 (1944), S. 4pp.
2. MacHardy, W. E. ; Gadoury, D. M.: A Revision of Mills Criteria for Predicting Apple Scab Infection Periods. In: Phytopathology 79 (1989), Nr. 3, S. 304-310
3. Stensvand, A. ; Gadoury, D. M. ; Amundsen, T. ; Semb, L. ; Seem, R. C.: Ascospore release and infection of apple leaves by conidia and ascospores of Venturia inaequalis at low temperatures. In: Phytopathology 87 (1997), Nr. 10, S. 1046#1053
4. Schwabe, W. F. S.: Changes in scab susceptibility of apple leaves as influenced by age. In: Phytophylactica 11 (1979), S. 53-56