
Strawberry powdery mildew – fruitweb forecast model
The fruitweb model for powdery mildew of strawberry (Podosphaera aphanis) is used to estimate the daily infection risk of this fungal disease based on weather data. The model makes it possible to identify phases with an increased risk of infection and thus better adapt plant protection measures to the actual conditions in the crop.
In addition, it is possible to use the empirical model tested by the Karlsruhe District Office of Agriculture (Arno Fried) in collaboration with the LTZ Augustenberg. It calculates the spraying distances to be selected in the foil tunnel for susceptible everbeaering varieties in order to minimise mildew infestation primarily on the berries and other plant parts.
Required weather parameters
- Air temperature
- Relative humidity
Optional weather parameters
- Leaf wetness duration
Field of application
Both models have been developed for use in polytunnels and greenhouses. They can also be used outdoors. However, the rain parameter is currently not taken into account. As this has a major influence on the development of powdery mildew on strawberries, the results have not yet been sufficiently tested in the field.
Functionality of the model
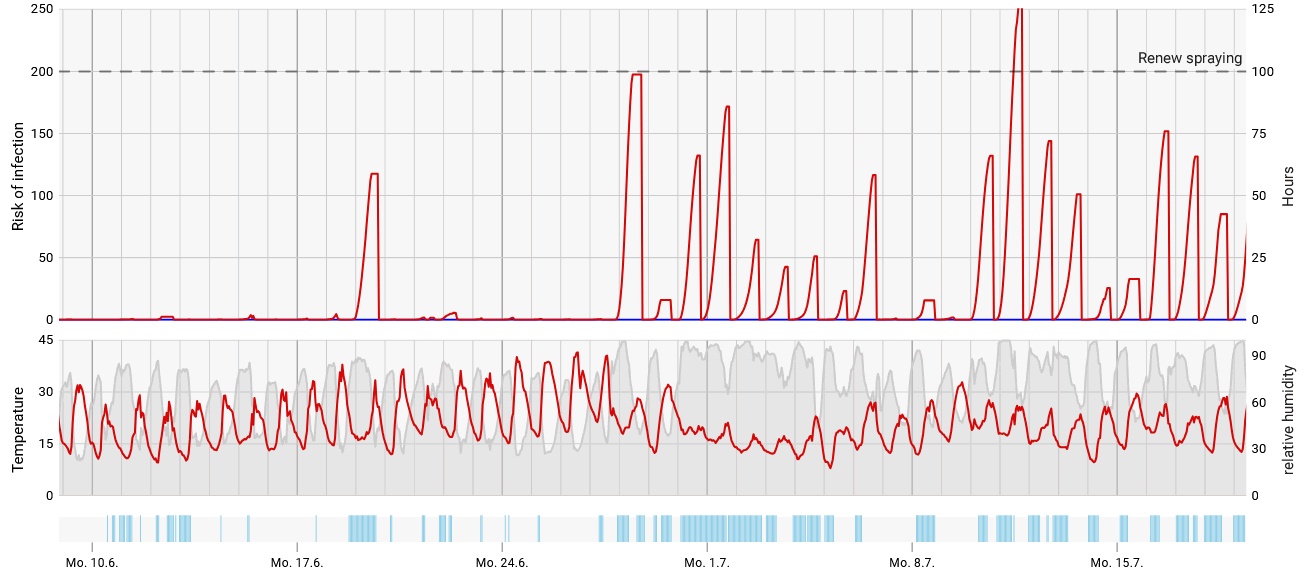
Fig 1: The model calculates the infection risk for mildew every day (red line in the top row). The higher the line rises, the greater the risk of infection. Below this is the progression of the key weather parameters temperature (red line) and relative humidity (grey area).
Infection conditions
In the fruitweb model, the risk of infection is calculated for each day based on the temperature and relative humidity (red line, top row). The higher the red line rises on a given day, the greater the risk of infection. The calculation always starts at 6 pm. The prerequisite for an infection is a relative humidity of at least 60%. The higher the relative humidity rises (without dew forming), the more spores begin to germinate. However, relative humidity has no influence on the speed of spore germination. This is determined solely by the temperature. The optimum range is between 18 and 22°C.
As a rule, the relative humidity and the temperature at night behave in opposite directions, i.e. the relative humidity rises in the evening and at night and thus often moves into the optimum range of over 90%. In contrast, the air temperature usually drops, which slows down spore germination. Optimum infection conditions therefore prevail with high relative humidity and temperatures around 20°C.
Determination of the spraying distances
In the UK, a model has been developed that can be used to optimise spraying distances when regulating strawberry powdery mildew in foil tunnels (Dodgson et.al 2021). However, trials conducted by the LRA Karlsruhe at the LTZ Augustenberg showed that the model cannot be directly transferred to the cultivation systems in Germany. However, very good results were achieved with an adaptation in the trial years 2023 and 2024 (Fried, A. 2025).
The hours with temperatures between 15.5 and 30°C and a relative humidity of over 60% are added up from the last spraying. As soon as the value of 100 hours is reached, a new spraying is recommended for susceptible varieties in the foil tunnel. In the period from the end of June, this led to spraying intervals of 5 to 10 days in the 2024 trials.
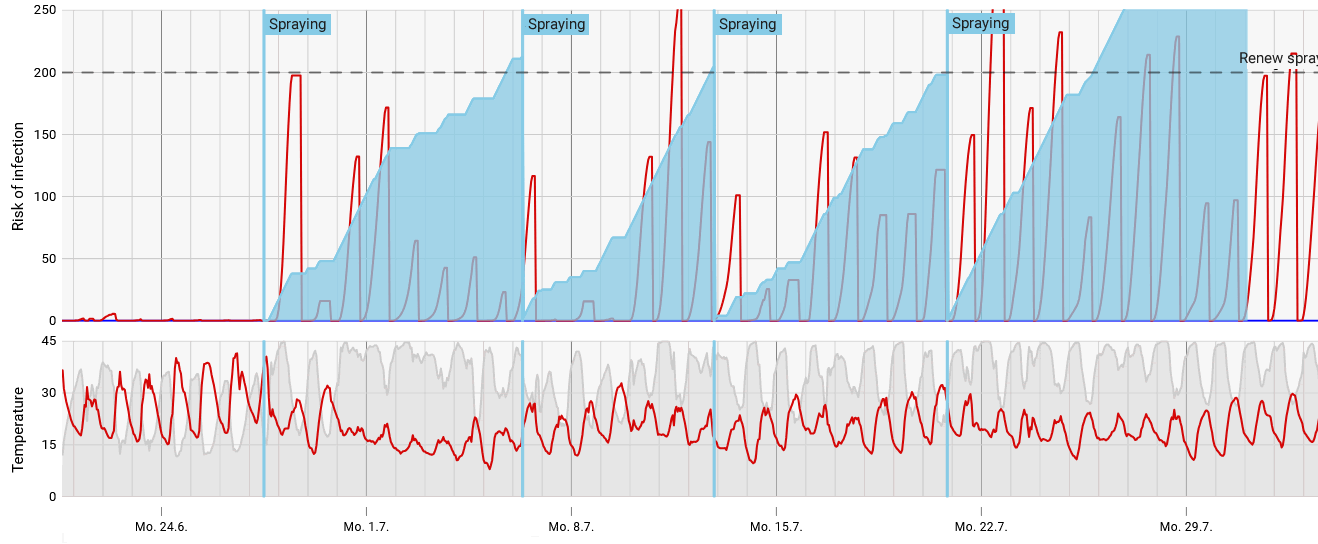
Fig 2: The sprayings can be entered in the model. The blue area shows the accumulated critical hours. For susceptible varieties, a new spraying is recommended when 100 hours are reached.
This model is an empirical model. It indirectly takes into account the host (growth of the strawberry plant), the pathogen (infection conditions) and the spraying (duration of coating, effectiveness of the authorised mildew preparations). However, it should be noted that the efficacy of the mildew preparations varies greatly and therefore subsequent treatments are not only dependent on the calculation of the model.
Combined use of fruitweb model and spraying model
For the period before the end of June, it makes sense not only to use the spraying model, but also to include the fruitweb model to a greater extent. In the period from March to June, the weather conditions repeatedly ensure that the spraying model indicates intervals of 20 days or more. This may be realistic in many cases. However, only a few days with infection conditions during this period are enough to cause a mildew infestation. The fruitweb infection model draws attention to such events and enables countermeasures to be taken.
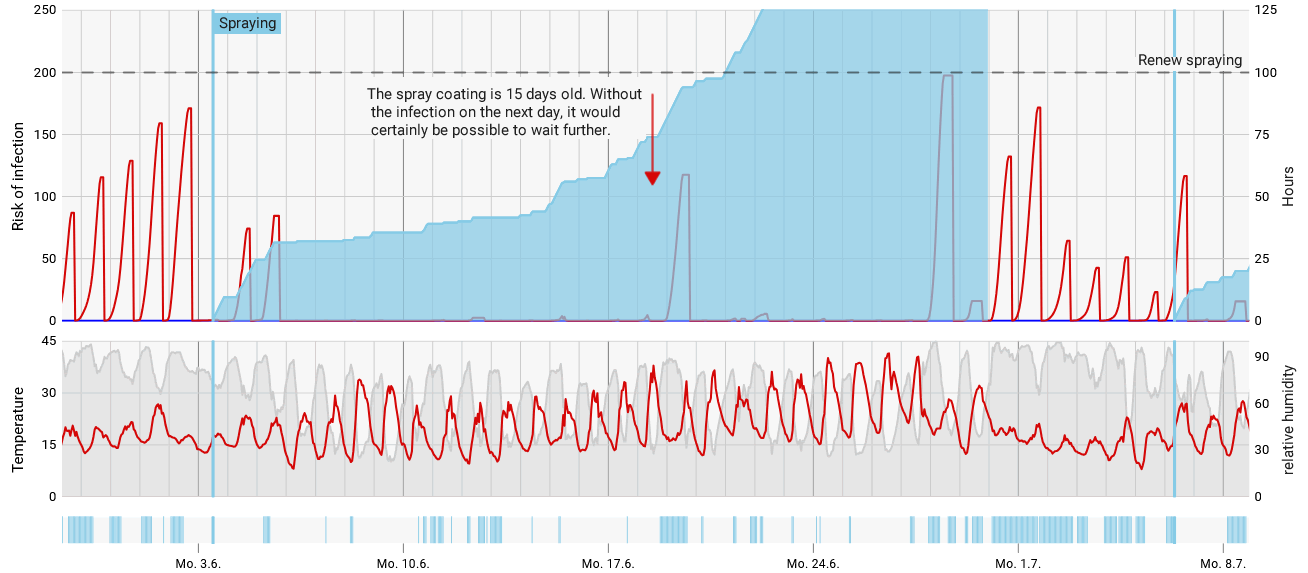
Fig 3: In this example, the spraying model calculates a spraying interval of 18 days. According to the fruitweb infection model, however, infection conditions occurred on the 16th day after spraying, which would certainly no longer have been covered by the treatment. Conversely, without this infection on the 16th day, according to the fruitweb model, further waiting would have been possible.
Adaptation of the plant protection strategy and crop management to the infection pressure
Over the course of the plant protection season, the infection pressure is primarily subject to weather-related fluctuations. The risk generally increases over the course of the season and is usually highest in July and August. The fruitweb model makes it possible to identify phases with no or low, medium and high infection pressure and to adapt the plant protection strategy and crop management (ventilation management) accordingly. (See graphic with green background: no to low risk, orange: medium risk, light red: high risk)
This applies on the one hand to the frequency of spraying and on the other hand to the choice of agents used. This minimises spray residues and the risk of resistance development and maximises the effectiveness of crop protection. The knowledge gained can also be used to improve ventilation management.
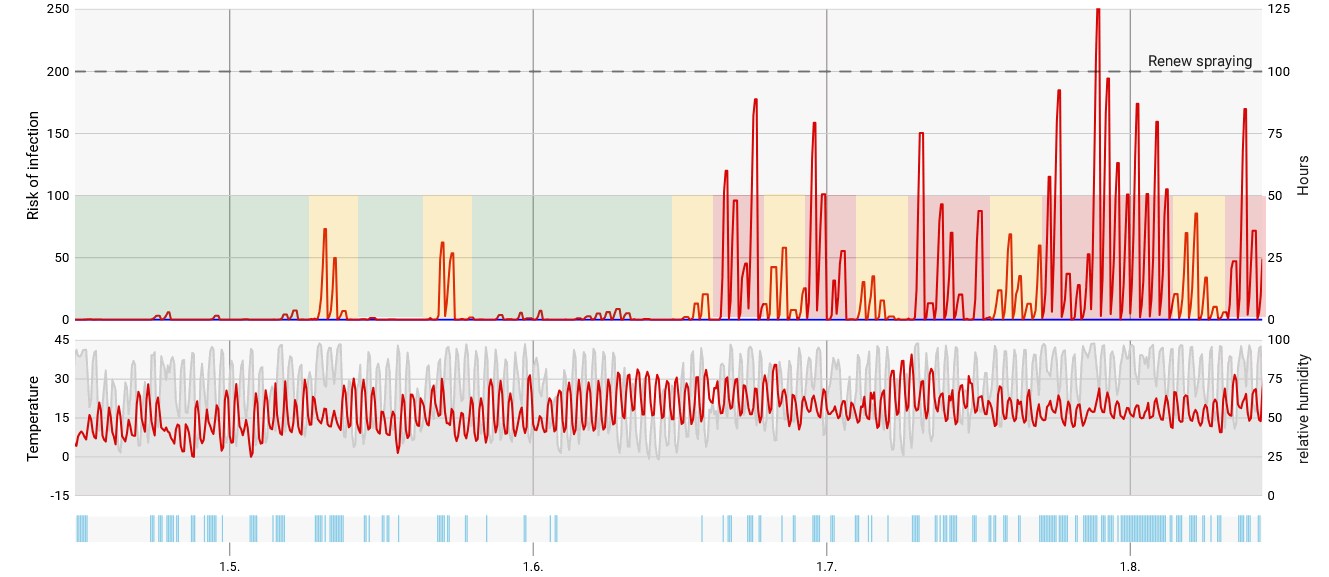
Fig 4: The phase with very high infection pressure (orange and red) usually begins sometime between the beginning and end of June. In the months before this, there are always longer periods with low infection pressure (green). However, depending on the year and ventilation management, it is also possible to have periods of high pressure in April and May.
The problem with the weather forecast
As there are no curative plant protection products available for the control of powdery mildew on strawberries, we are dependent on a weather forecast to predict the infection conditions. Unfortunately, this is currently only available for the weather outside the tunnel. Experience from the years 2022 to 2024 has shown that the forecasts outside the tunnel provide a satisfactory assessment of the infection conditions. However, we are endeavouring to further improve the informative value of the fruitweb model and the spraying model and will therefore develop an individual weather forecast for each foil tunnel with the help of AI in 2025 and offer it as a service in 2026.
Literature
Dodgson, J. L., Liu, B., Wileman, H. J., Mutasa-Gottgens, E. S., & Hall, A. M. (2021). Development and evaluation of a decision prediction tool for the reduction of fungicide applications for the control of strawberry powdery mildew epidemics. bioRxiv, 2021-08.
Fried, A., Schell, E., Steinecke, G. (2024), Erdbeermehltau-Regulierung im Freiland und im geschützten Anbau, Vortrag Bundesbeerenobstseminar am 6.2.2025, Übergebietliche Pflanzenschutzberatung Obstbau, Landwirtschaftsamt Bruchsal
Peries, O. S. (1962). Studies on strawberry mildew, caused by Sphaerotheca macularis (Wallr. ex Fries) Jaczewski* I. Biology of the fungus. Annals of Applied Biology, 50(2), 211-224.